System and Services metrics
On Software Factory, a metric stack could be deployed to provide system and services metrics (zuul and nodepool). When the metrics stack is activated, the following components are deployed:
- Telegraf: a plugin-driven server agent for collecting and reporting metrics.
- Influxdb: a time series database for storing metrics.
- Grafana: a platform for analytics and monitoring.
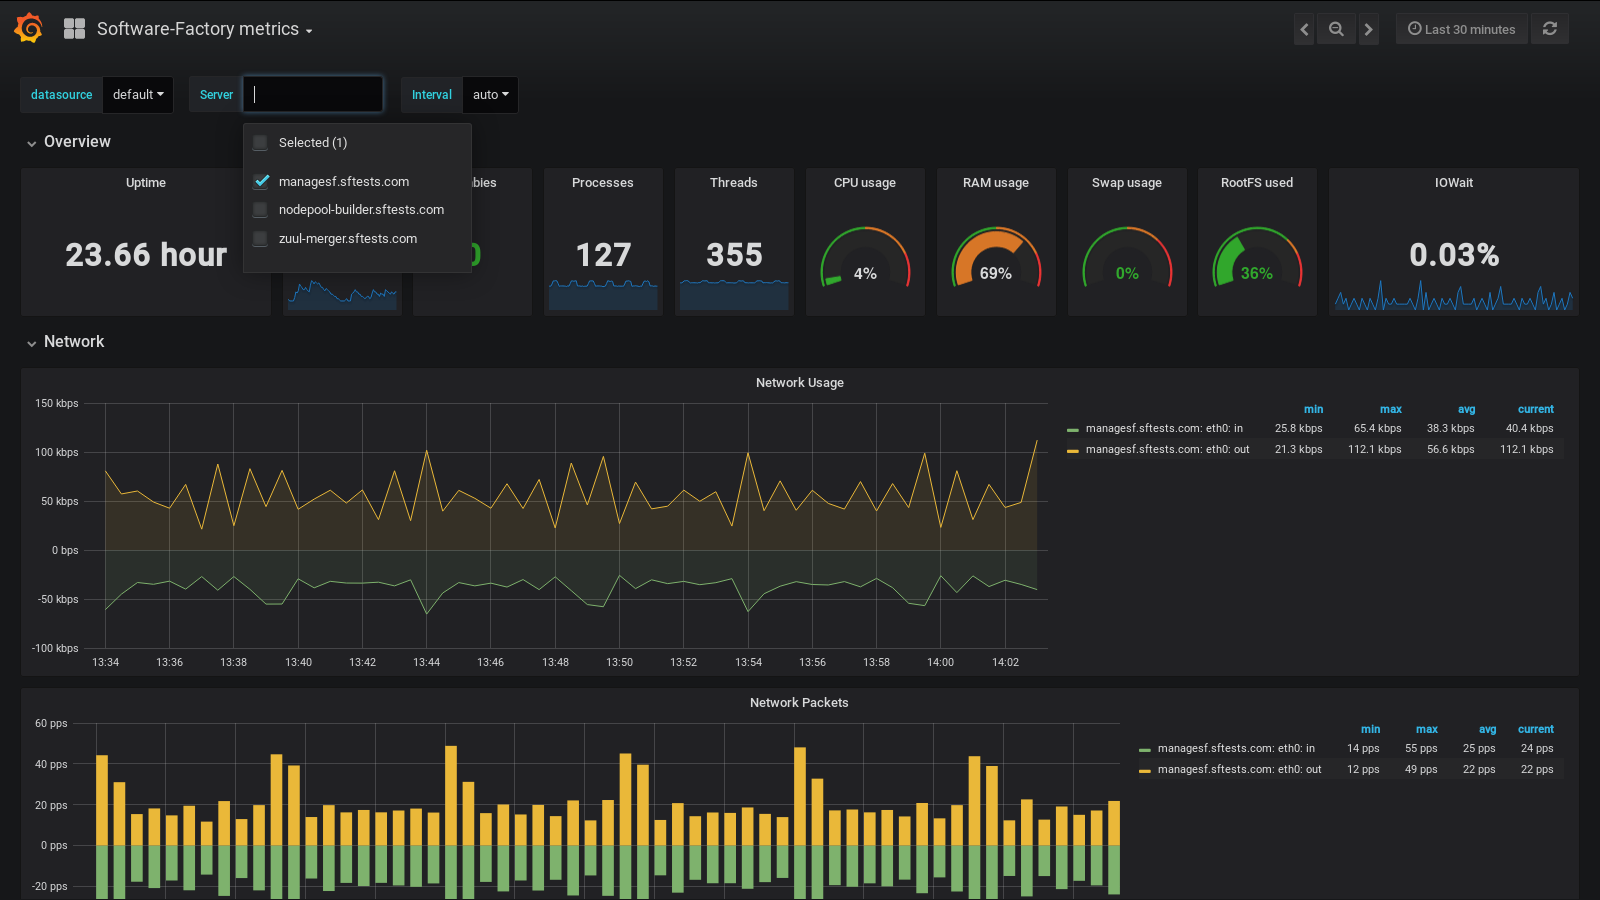
As operator, you can understand how the metrics are implemented on Software Factory. To activate metrics, follow the operator documentation.
As users, you can have a look to the user documentation to understand how to use or add dashboards.